Combining Time Frames
Combining Time Frames
When someone asks a trader, “What do you think about the market outlook?” the trader has to know
the degree of time or trend the person is talking about. Does he mean the outlook for the next six
months, the next month, the next week or the next six hours? If he wants the outlook for the next six
months, trader will analyze the weekly time fra me chart, but if he wants the outlook for the next
week then the weekly chart is quite useless. Trader would need to analyze the daily, or more probably
hourly, chart for that particular analysis. If we think about it in trend -following terms, when we
define a trend by the slope of a moving average, then a market can be in an uptrend in the monthly
time frame, a downtrend in the weekly frame, an uptrend in the daily frame and a downtrend in the
hourly frame. On each degree of time, therefore, analysis of a market can and does show different
conclusions.
However, for a day trader knowing the market structure from weekly to h1 time frame will help to
know the cycle in which the market is in each of these time frames. The higher time frame trend will
dominate the lower ones but not to discount the fact that the first signal of change in trend of a higher
time will appear on lower time frame.
Know the weekly market structure whether in correction or trend. If correction which leg of
correction it is, 1st wave, 2nd wave, 3rd wave?
The best set up is to trade the end of wave C of a corrective wave 2 or wave 4 for the next Motive
wave which is wave 3 or wave 4. So for e.g. if weekly is in a 4th wave of an impulse, we would like
to trade the 5th wave of the same impulse : we analyze the shorter time frames to know the end of
the wave C of the wave 4 of weekly, since the wave 4 must have 3 legs (ABC), we check if the wave
C is running , if yes then we analyze the wave C on daily and count the waves within this leg , if this
wave C shows 5 waves inside it on daily then check for divergence between the 3rd and 5th, if yes
,go to h4 time frame and check waves inside the 5th wave, if there are smaller waves then check for
divergence between the last two impulses, if yes then go to h1 and draw trendline, wait for price to
break the trendline or the last swing high/low. When there is change of trend, check if the last wave
is impulsive (sharp and fast), if yes then draw fib of the impulse and wait for correction to touch 61
or 78 pc where you can plan to enter. (Trade set ups steps will be explained in details in further
slides.)
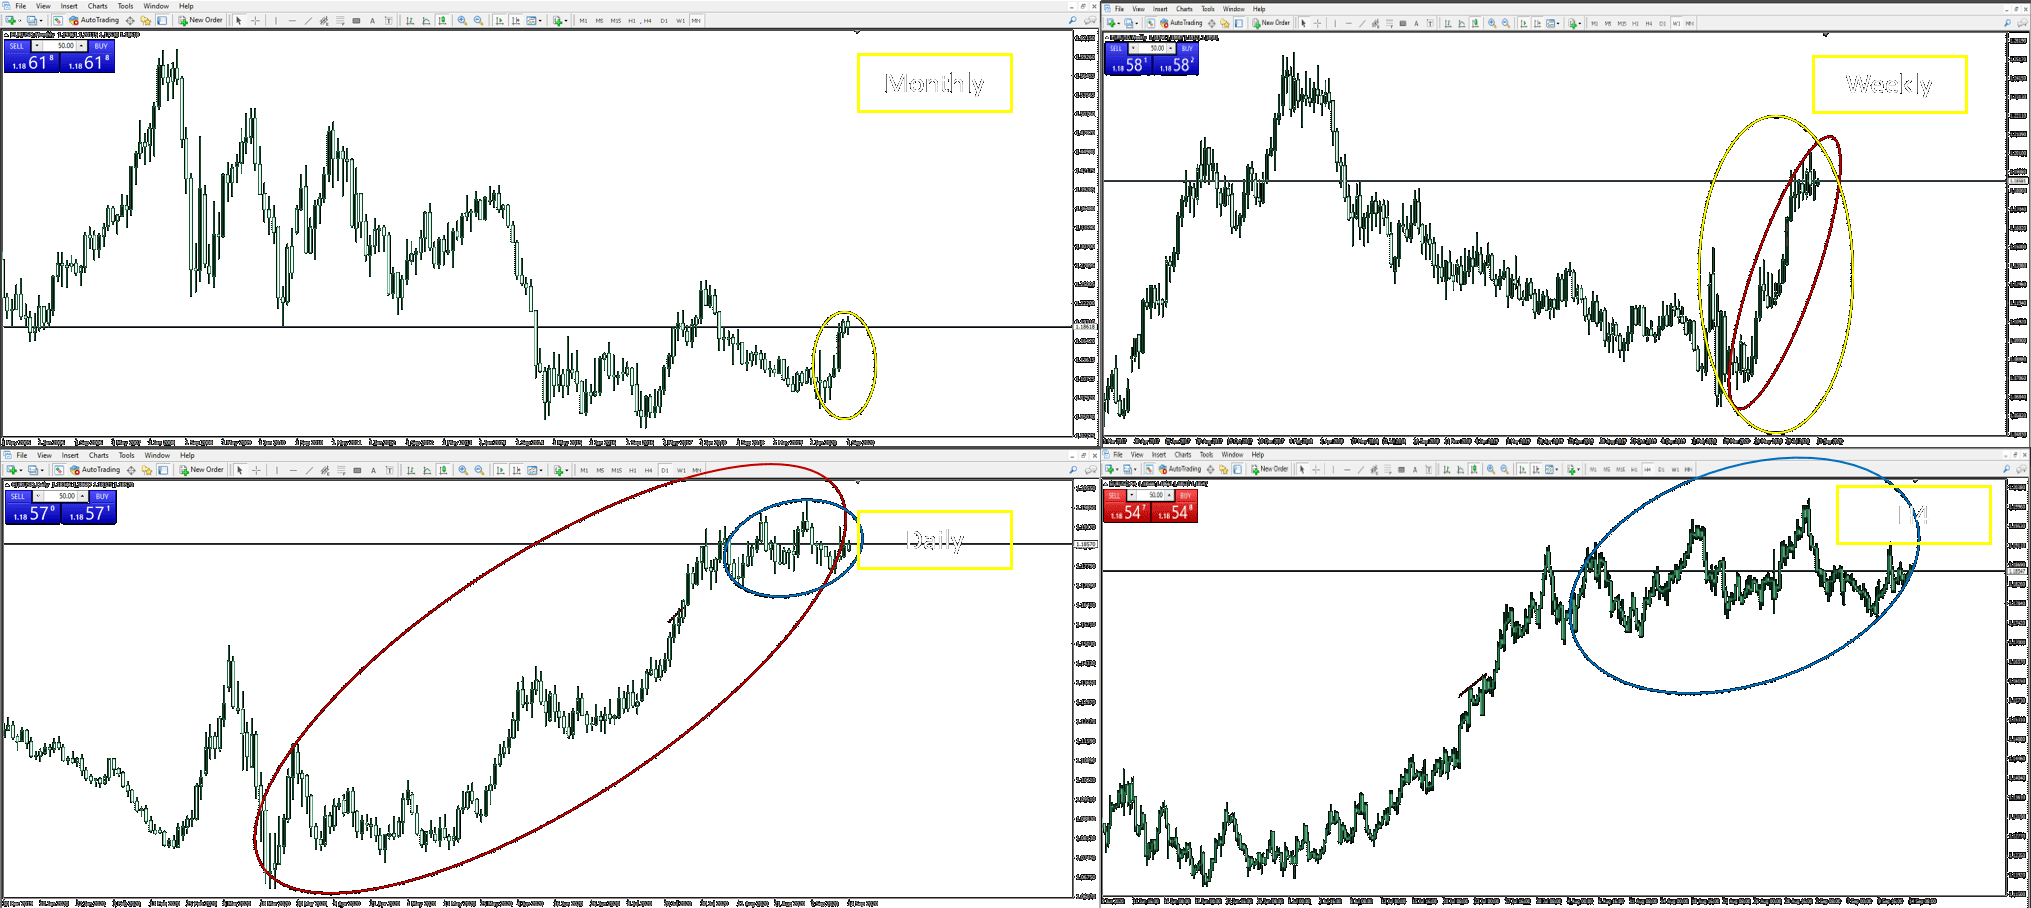
Below picture shows how you can analyze every last leg of th e time frame in the next shorter time
frame. First analyze the whole of monthly chart then take the last leg of monthly (as shown by yellow
circle and move on to weekly to analyze that leg. Once you have analyzed the yellow circle on
weekly, take the last leg of weekly and move on to Daily to analyze it. This way you continue moving
on till the shortest time frame that you want to have your trade set up on. We suggest to keep H1 as
the trade set up time frame.
monthly - M
weekly - W
Daily - D
4 Hour - H4
1 Hour - H1
Images
Comments (0)
- No comments yet.