Price Swings
Price Swings
A price chart is a sequence of prices plotted over a specific timeframe.
Price swings are formed on chart by group of candles that share the same characteristics in
direction and strength.
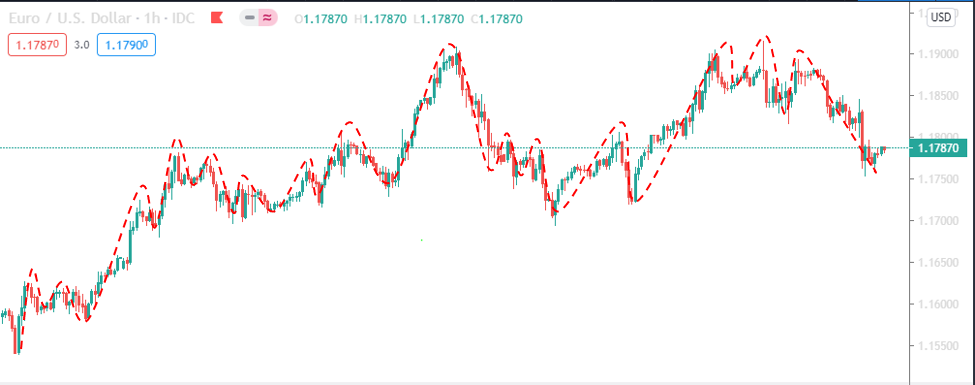
The red dotted lines in the chart below mark the price swings of different degrees moving up or
down.
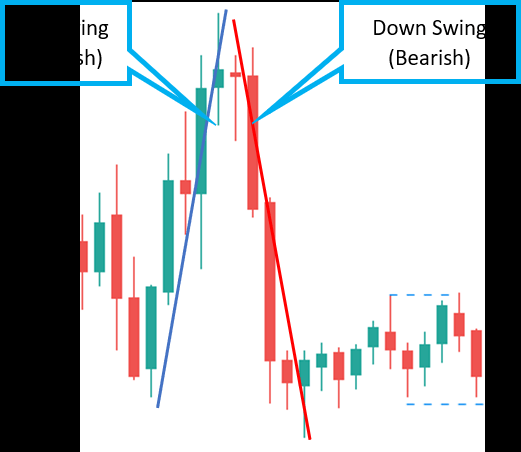
Direction
Up (Bullish) or Down (bearish)
Strength:
Impulsive or corrective swings
• Impulsive swings are quickly moving in one direction hence showing strength in the
movement.
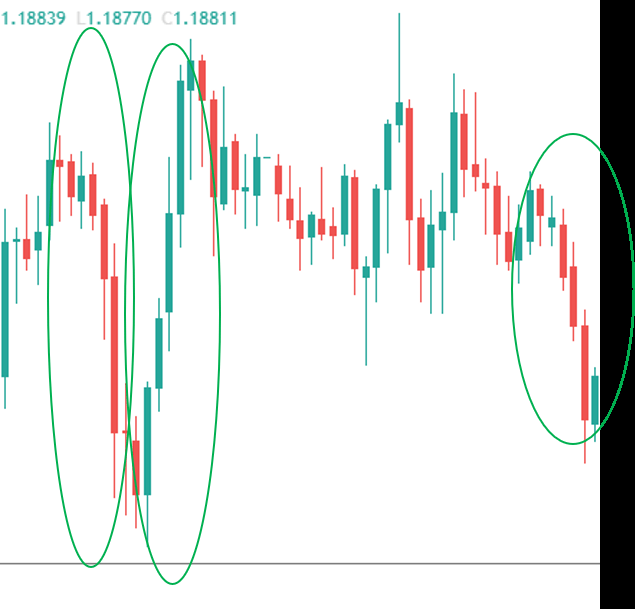
How to identify impulsive swings? In a down impulsive swing, majority (at least 60%) of the
candles are bearish and majority of the candles close near their lows. Sequence of candles are
lower highs and lower lows.
In an up impulsive swing majority (at least 60%) of the candles are bullish and majority of the
candles close near their highs. Sequence of candles are higher high higher lows.
Green circled ones are impulsive swings.
More characteristics of impulsive waves
• They are sharp
• They are fast
• They are trending (refer to lesson “Trend”
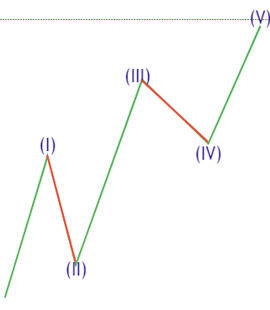
• Wave 2 should not go under wave 1
• Wave 3 should not be the shortest wave
• Wave 4 should not go to price territory of wave 1
• Wave 2 and 4 should be similar in price and time by at least 70%
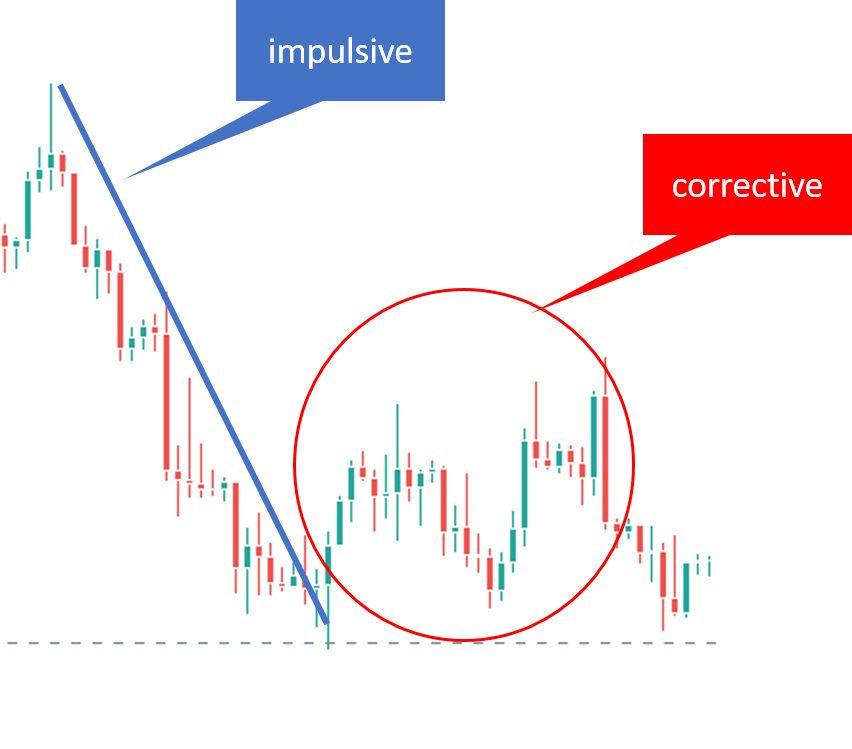
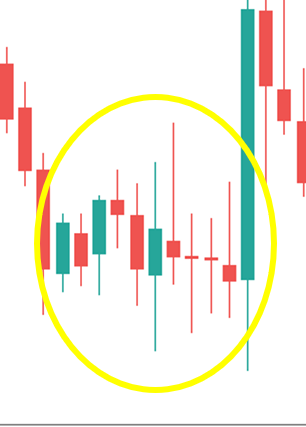
Corrective swings are slow moving, indecisive and sideways
How to identify corrective swing? Candles are mixed (50-50): bullish, bearish, dojis. Most of
candles close near the middle, lot of indecision candles (dojis), No sequence of higher highs,
higher lows or lower highs lower lows. In the below picture yellow circled part is corrective swing.
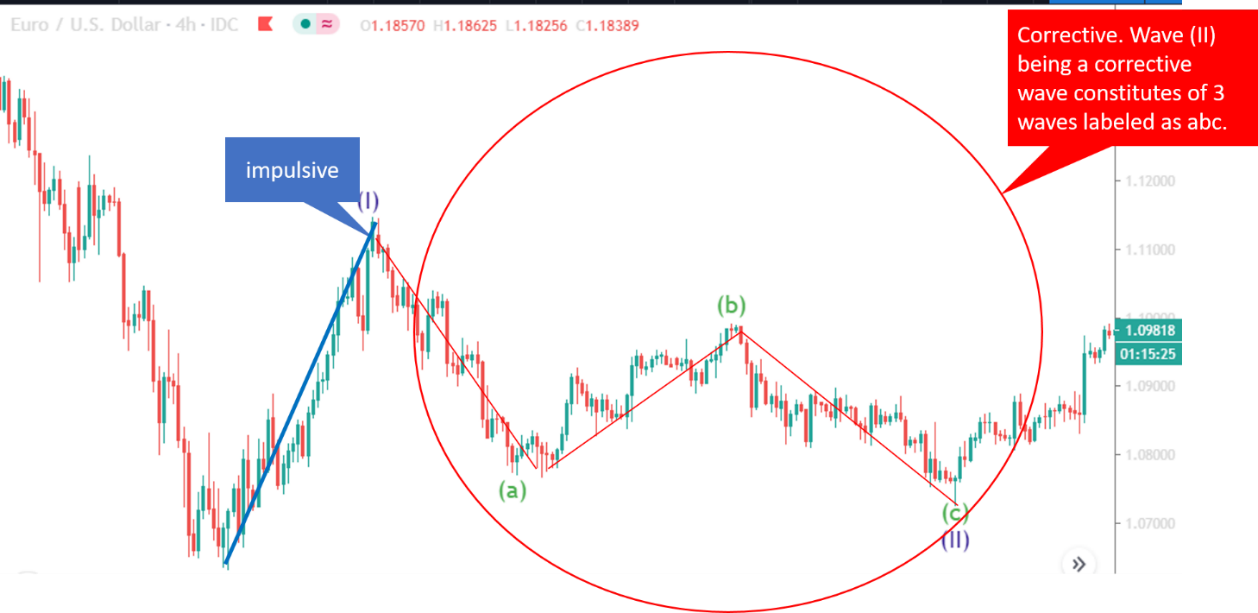
More characteristics of corrective waves
• They usually take more time than their impulsive waves
• They are both trending and non-trending
• They are at least 3 waves
Images
Comments (0)
- No comments yet.