Fractals & Degrees
Fractals & Degrees
Fractals refer to the phenomenon observed in Elliott Wave and Chaos Theories that natural life
evolves in a series of self-similar patterns at each degree of evolution. A market evolves in a series
of self-similar patterns at each degree of trend or each degree of time.
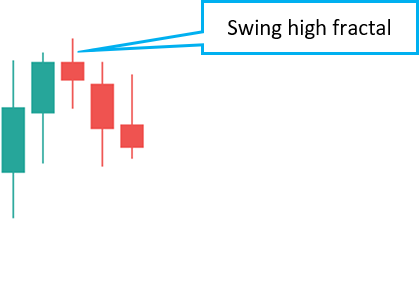
Fractals are the smallest of swings in a chart. One swing high fractal is formed when there are at
least 2 candles to the left and two to the right having their highs lower than the high of the swing
high candle.
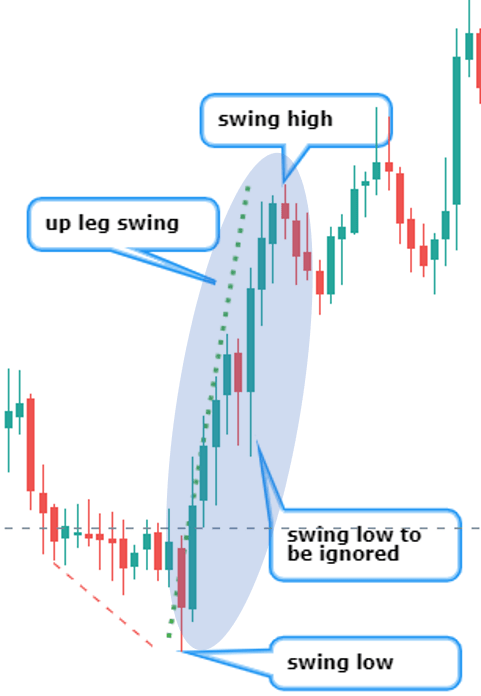
It takes one swing low and swing high to make one swing leg. If the swing low is before the swing
high, it’s an up leg (bullish leg) as shown in the picture below. Sometimes there are two swings
low before a swing high, in this case we ignore the middle swing low as shown in picture below.
The whole of blue shaded area is one fractal.
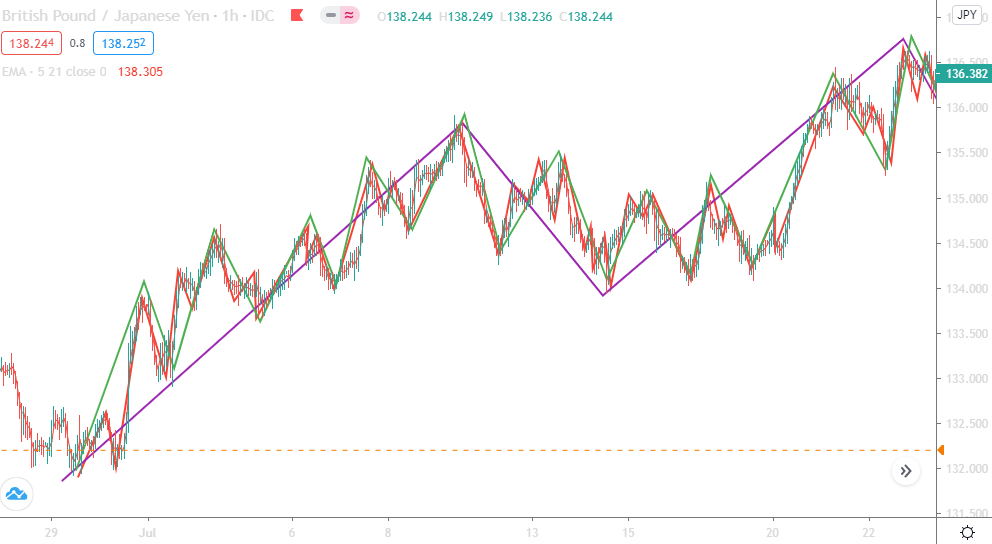
A larger degree fractal will have smaller degree fractal inside it. Below there are three degrees of
fractals: swings marked with purple, green and red lines.
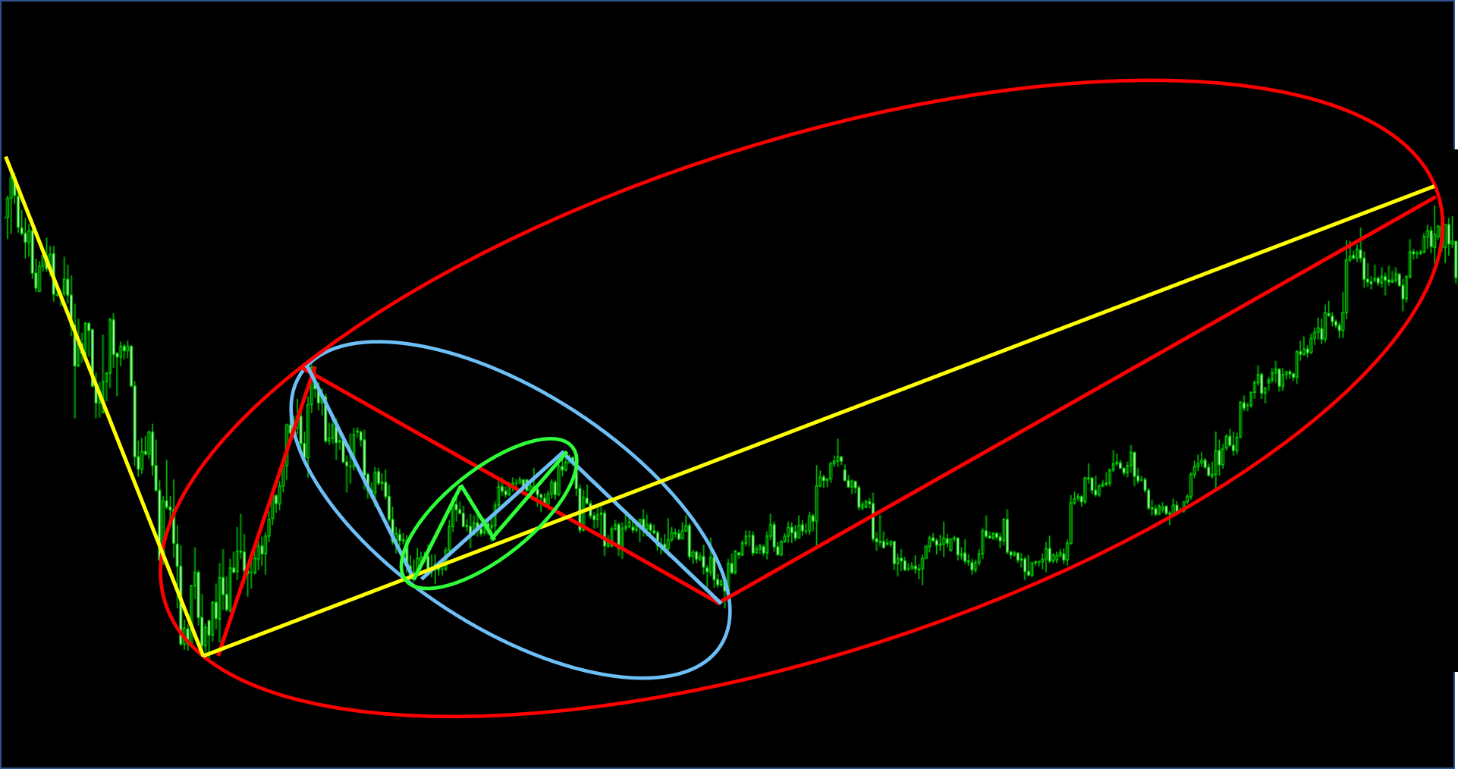
In the image below, the circled waves are correction. Each impulse has its correction and then
resumes trend with another impulse. Each color is one degree structure, so the yellow is highest
degree structure and green is the smallest degree structure. The ones that have a set of Impulse-
correction-Impulse are circled with their respective colors.
Recognizing Degrees
Degrees can be recognized in a chart with help of time factor of the corrective waves with respect
to its impulsive waves. It can also be identified with help of trendline.
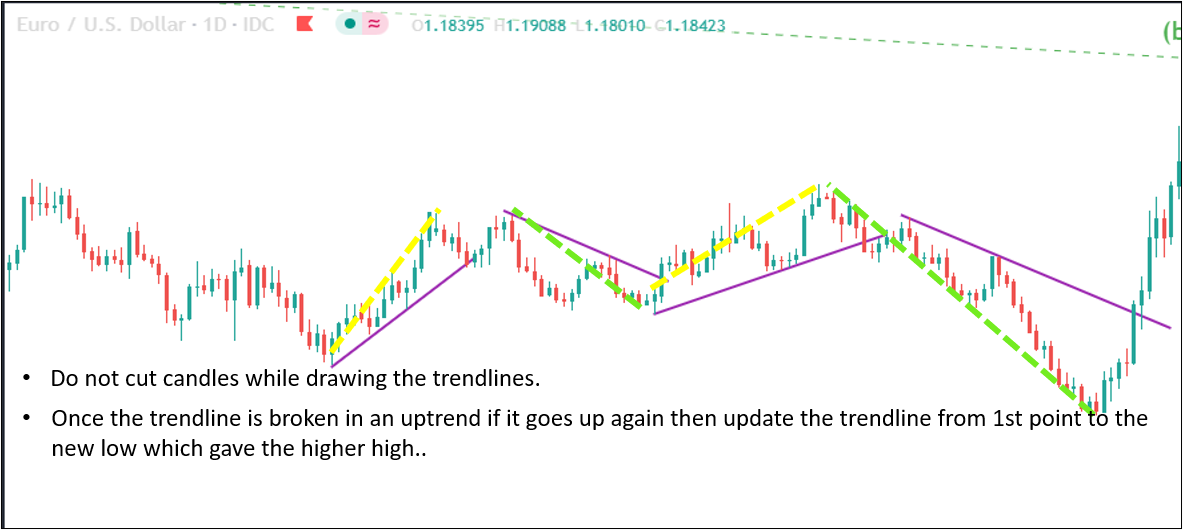
How to draw trendline. The purple line is the trendline drawn joining two impulsive waves.
• Connect the last two bottoms of the impulses in uptrend and two tops of the last two
impulses in downtrend.
• Trendline is to be drawn joining only the last two impulsive waves.
• Trendline is always at the right side of the chart.
Trending mode
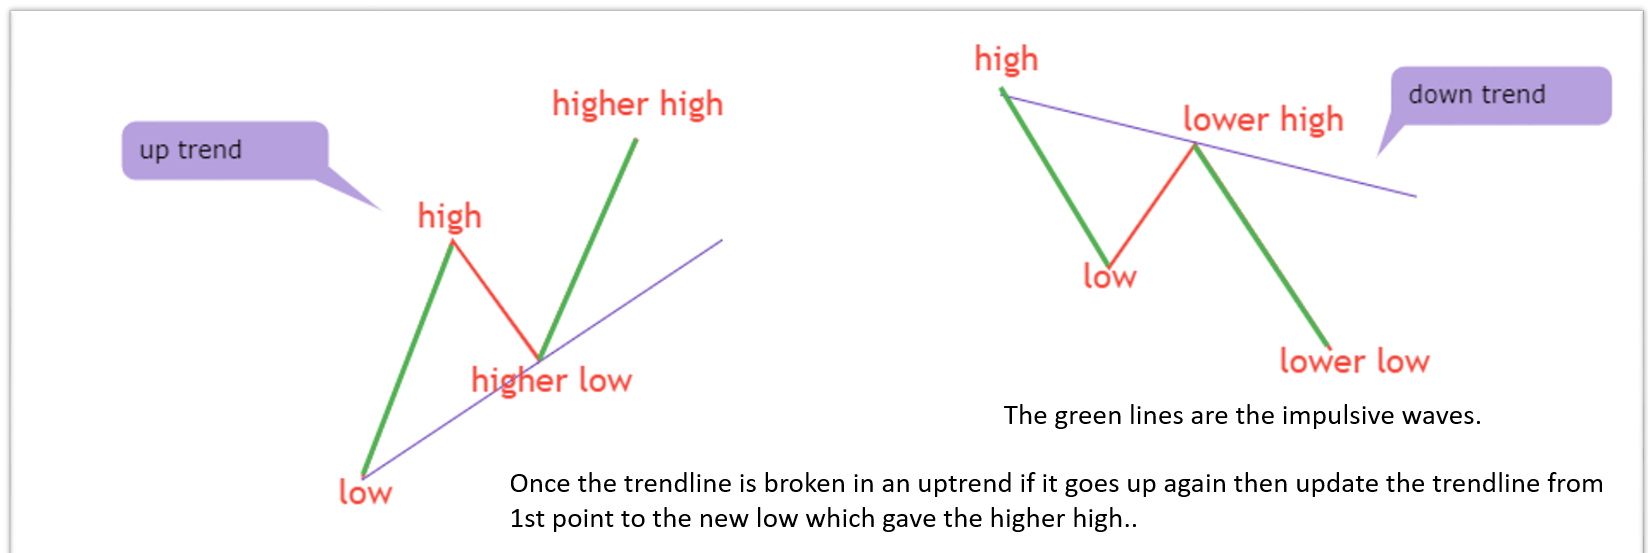
Up trend: low, high, higher low
and higher high;
Down trend: high, low, lower high
and lower low
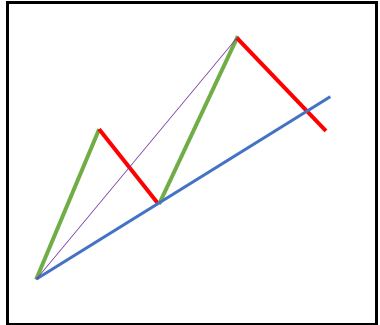
When a trendline is broken, the whole set of impulsive and corrective waves become one
impulsive wave of one degree as shown in fig. 8 the purple line is marking the one single
impulsive wave that formed after break of trendline. The break of purple trendline in fig. 9 below
shows the formation of a single degree wave after break of the trendline.
fig. 8
fig. 9
Images

Comments (0)
- No comments yet.