Charts & Candlesticks
Before a chart makes sense, a handful of terms need to be second nature — pip, lot, leverage, and margin describe the units a chart's price moves are measured in and the mechanics behind opening a position at all. This lesson works through those terms, then moves into how a price chart is built and what a single candlestick communicates.
Pips, lots, leverage, margin
A pip ("point in percentage") is a unit of measurement for the smallest typical change in value between two currencies — usually a single-digit move in the fourth decimal place of a currency pair's quote.
A lot is simply the amount of a currency pair being bought or sold — the size of the trade. Lot sizes come in three common denominations: a standard lot (also called "volume 1" in MT4) is 100,000 units of currency, a mini lot is 10,000 units, and a micro lot is 1,000 units.
Leverage gives a trader the ability to control a larger amount of money than they've deposited, by borrowing the rest from the broker — functionally a loan that expands the trader's available capital beyond their initial deposit. For example, a trader with $1,000 of capital and 1:10 leverage has access to $10,000 of buying power instead of the original $1,000.
Margin is the portion of a trader's funds that a broker sets aside from the account to open and maintain a position — similar to a security deposit held by the broker for as long as the position stays open, which helps cover any losses the position accumulates while it's live.
Charts
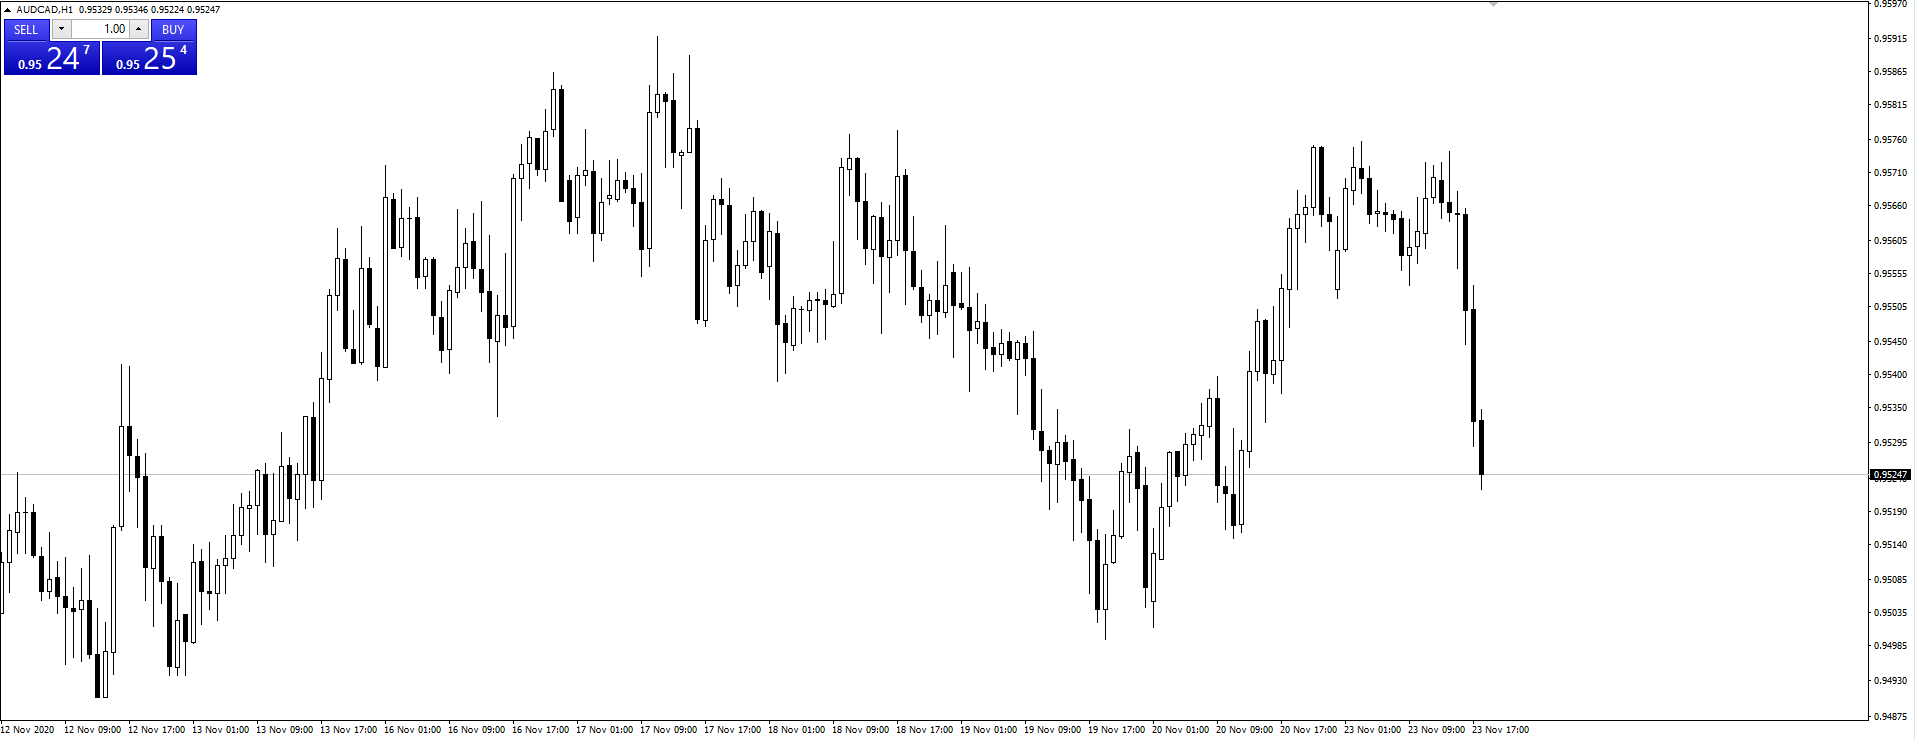
A price chart is simply a sequence of prices plotted over a specific timeframe. A candlestick chart is one common way of plotting that sequence, where each candlestick summarizes price movement over one unit of time on the chart.
Candlesticks
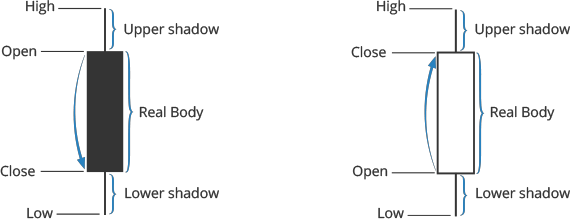
Each candle encodes four prices for its time period: the open (O), the close (C), the high (H), and the low (L). A candle where the close is above the open is typically shown as a bull (up) candle; a candle where the close is below the open is typically shown as a bear (down) candle.
What a candle communicates about market direction
A candle is a compact record of buying and selling pressure over its time period, and reading a handful of candles together gives a sense of which side is currently in control:
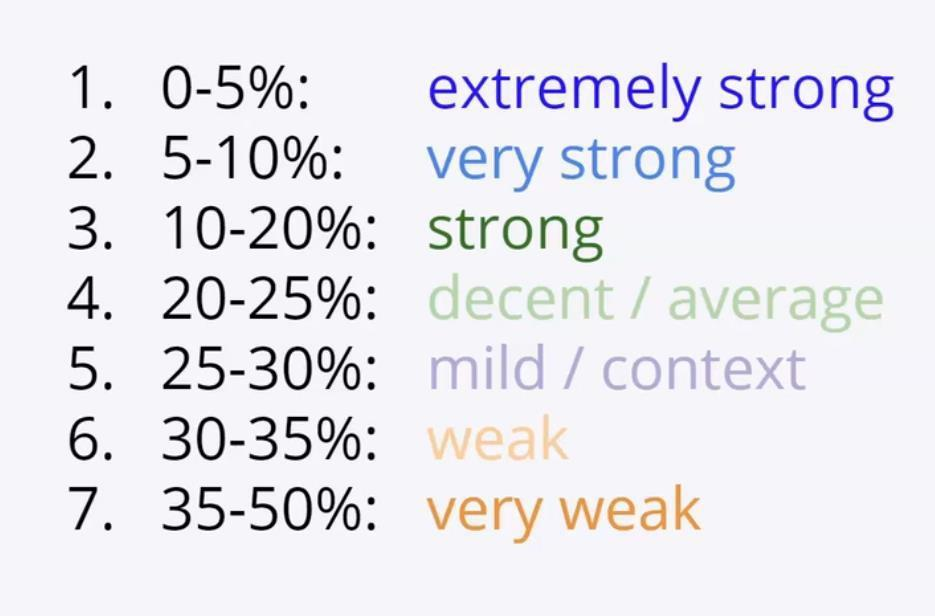
- Candle size helps gauge whether trend momentum is strong or weak — a larger candle body generally reflects more decisive pressure in one direction during that period.
- Because a candle summarizes price movement over a set period, it indicates whether a currency was bought more or sold more against its pairing currency during that window. A run of several candles closing in the same direction can indicate sustained momentum in that direction.
Read together, a sequence of candles is one of the more direct ways to see which side of the market — buyers or sellers — held the upper hand over a given stretch of time.
Images





Comments (0)
- No comments yet.