Candlestick Charts in Detail
Candlestick Charts in Detail
Dating as far back as the 17th century, the Japanese began using technical analysis to trade on rice.
Hence, the Japanese Candlesticks commonly in use today.
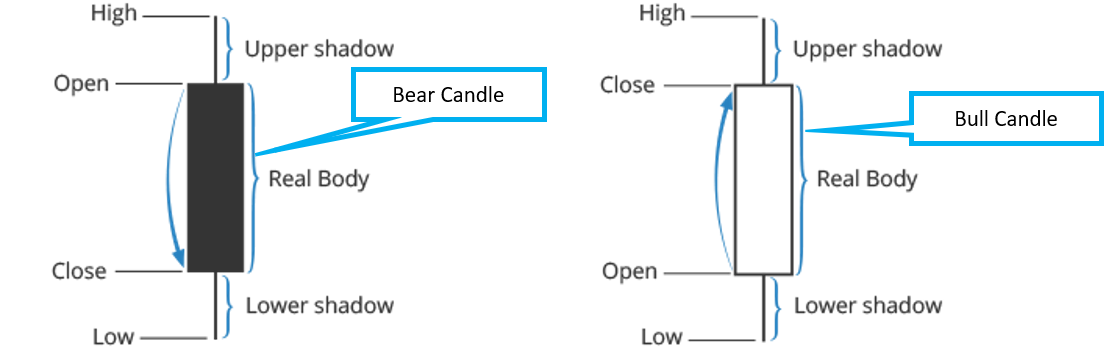
The data relayed from the candlestick includes the highs, lows, open and close prices.
The ‘hollow’ and the ‘colored’ portions are called the body. The long thin lines above and below
the ‘body’ represent the high or low ranges and are also referred to as either shadows, wicks or
tails.
The vertical line at the top of the body tells you the high and close price, while the line at the
bottom of the graph indicates the low and the low’s close price.
The colors of the candle body can vary from broker to broker.
If the open is at the top and close is at the bottom, it will indicate a bear candle meaning there were
more sellers than buyers from the time the candle opened till it closed.
Vice versa, if the close is at the top and open at the bottom, it will indicate a bear candle meaning
there were more buyers than sellers from the time the candle opened till it closed.
Since we are going to use candlestick chart, let’s get more familiar with candlestick and its forms
and patterns in our next lesson.
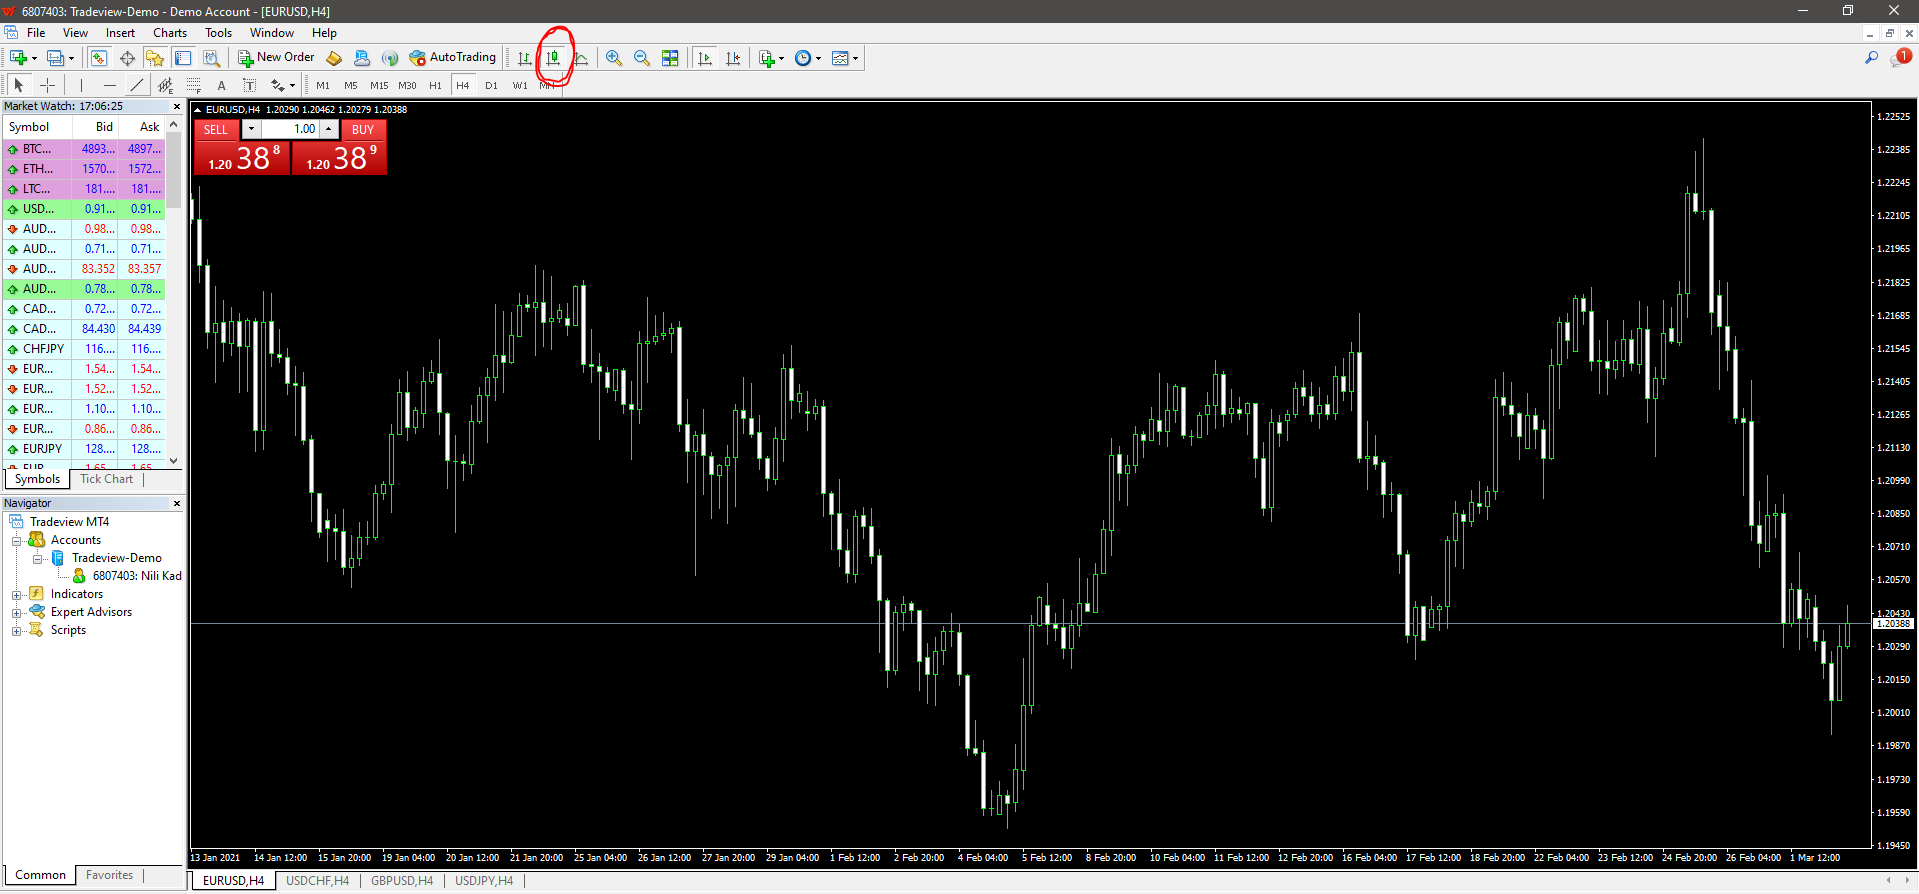
Candlestick chart on MT4 terminal
Choose this for
candlestick chart
Images
Comments (0)
- No comments yet.