Reading a CAT analysis
Nine lessons in, you have the vocabulary: motive and corrective structure, the impulse rules, the corrective shapes, degree, Fibonacci tendencies, invalidation, a top-down workflow, and the traps that undo all of it if applied carelessly. This last lesson connects that vocabulary directly to what actually shows up when CAT posts a wave-based read, so that an analysis on the wall reads as a specific, checkable argument rather than an opaque verdict.
The heading tells you what kind of statement this is
Every analysis on CAT opens with a line in the form "How our system reads [symbol] [timeframe]" — a small but deliberate wording choice covered back in lesson 1: it's a description of what the current wave count sees, not an instruction and not a promise. Everything under that heading is meant to be evaluated the same way you'd evaluate any wave count in this module — against the structural rules, not taken on faith because a system produced it.
Scenarios are just labeled wave counts
Underneath the heading, an analysis lists one or more scenarios, each with a short label and a plain-language read. A scenario is nothing more exotic than a wave count from this module, written out: which degree is active (lesson 5), whether the current stage is motive or corrective (lesson 2), and what that implies about what should happen next if the read holds. When an analysis lists more than one scenario, that's the honest acknowledgment from lesson 4 and lesson 9 that some price action is genuinely ambiguous between two structural readings until it resolves — multiple scenarios aren't hedging for its own sake, they're the same "I'm not sure yet, and here's specifically what would settle it" discipline this module has pushed since lesson 1.
The level table is lessons 6 and 7, formatted
Where a scenario carries specific levels, they're shown in a small table with three possible rows: the entry zone the system marks, the targets the system projects, and the level that invalidates this read. That third row is exactly the invalidation concept from lesson 7 — a specific, pre-stated, close-based level, published before the outcome is known, not adjusted afterward. The line just below the table, "what would change this read," restates that same invalidation level in a sentence, because it's the single most important number in the whole analysis: it's the system's own answer to the question this module has asked in every lesson.
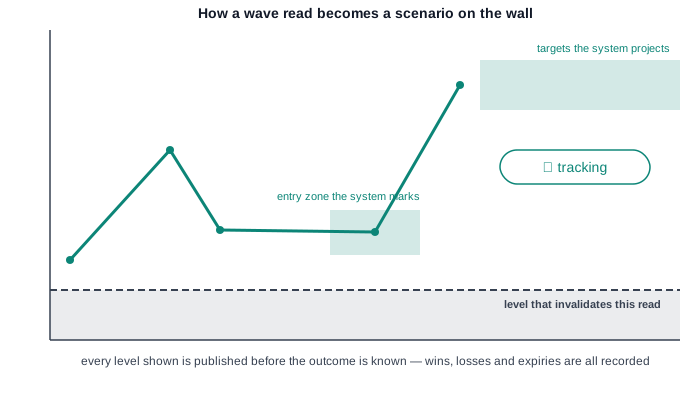
Tracking badges: the honest record in miniature
Once an analysis is posted, its levels don't just sit there decoratively — CAT tracks what actually happens against them and shows the result as a small badge on the wall and on the analysis itself. An hourglass badge means the levels are still live and unresolved, exactly like a wave count mid-formation in any lesson above. A checkmark badge means price reached the target zone before the invalidation level broke. An X badge means price closed beyond the invalidation level first — the wave-analysis equivalent of the count failing the exact test lesson 7 describes, recorded rather than quietly forgotten. An hourglass-timeout badge means neither outcome happened within the tracking window, which is reported as its own honest category rather than folded into a win or a loss it didn't actually earn. And an open-book badge marks analyses that never carried trackable levels in the first place — some wave reads are structural commentary without a specific entry/target/invalidation triple, and labeling those "untrackable" rather than silently excluding them is part of the same honesty this badge system is built around.
Why the record is published unfiltered
CAT's public track record shows every one of those outcomes — wins, losses, expiries, and untrackable reads alike — with the counting method stated, rather than only publishing the flattering half. That policy isn't an accident of design; it's the direct, product-level expression of the discipline threaded through every lesson in this module. A wave count that's allowed to quietly drop its failures, or redraw its invalidation line after the fact, stops being checkable — it becomes exactly the kind of unfalsifiable story lesson 7 warned against. Publishing the full record, badge by badge, is what keeps a wave-based analysis method honest at the scale of hundreds of calls instead of just one.
What would invalidate this read
The claim this lesson makes is that CAT's analyses are legible using nothing more than the concepts taught across this module — that a scenario, a level table, and a tracking badge are just this module's vocabulary wearing product formatting. That claim would fail if the badges and levels turned out to mean something looser than they're described here, or if the published record quietly excluded outcomes that made the method look worse. Neither is the case: the level table's three rows map directly onto the entry, target, and invalidation concepts from lessons 6 and 7, the badges map directly onto win/loss/expiry/untrackable as defined by the tracking method, and the record is published whole. Read a CAT analysis the same way this module taught you to read any chart — ask what the count requires to stay valid, and check whether it still does.
Comments (0)
- No comments yet.